Your First Kaggle Challenge: CRISP-DM in Action
Welcome to our Kaggle journey! If you’re curious about AI and machine learning but feel a bit overwhelmed, you’re in the right place. Think of Kaggle as your friendly neighborhood playground for data science: a place where you can learn, experiment, and grow alongside a supportive community.
This is the second step, if you’re following along, you should have already completed the first step, which is to First Steps on Kaggle: a friendly guide to getting started with Practical AI.
Choosing Your First Challenge
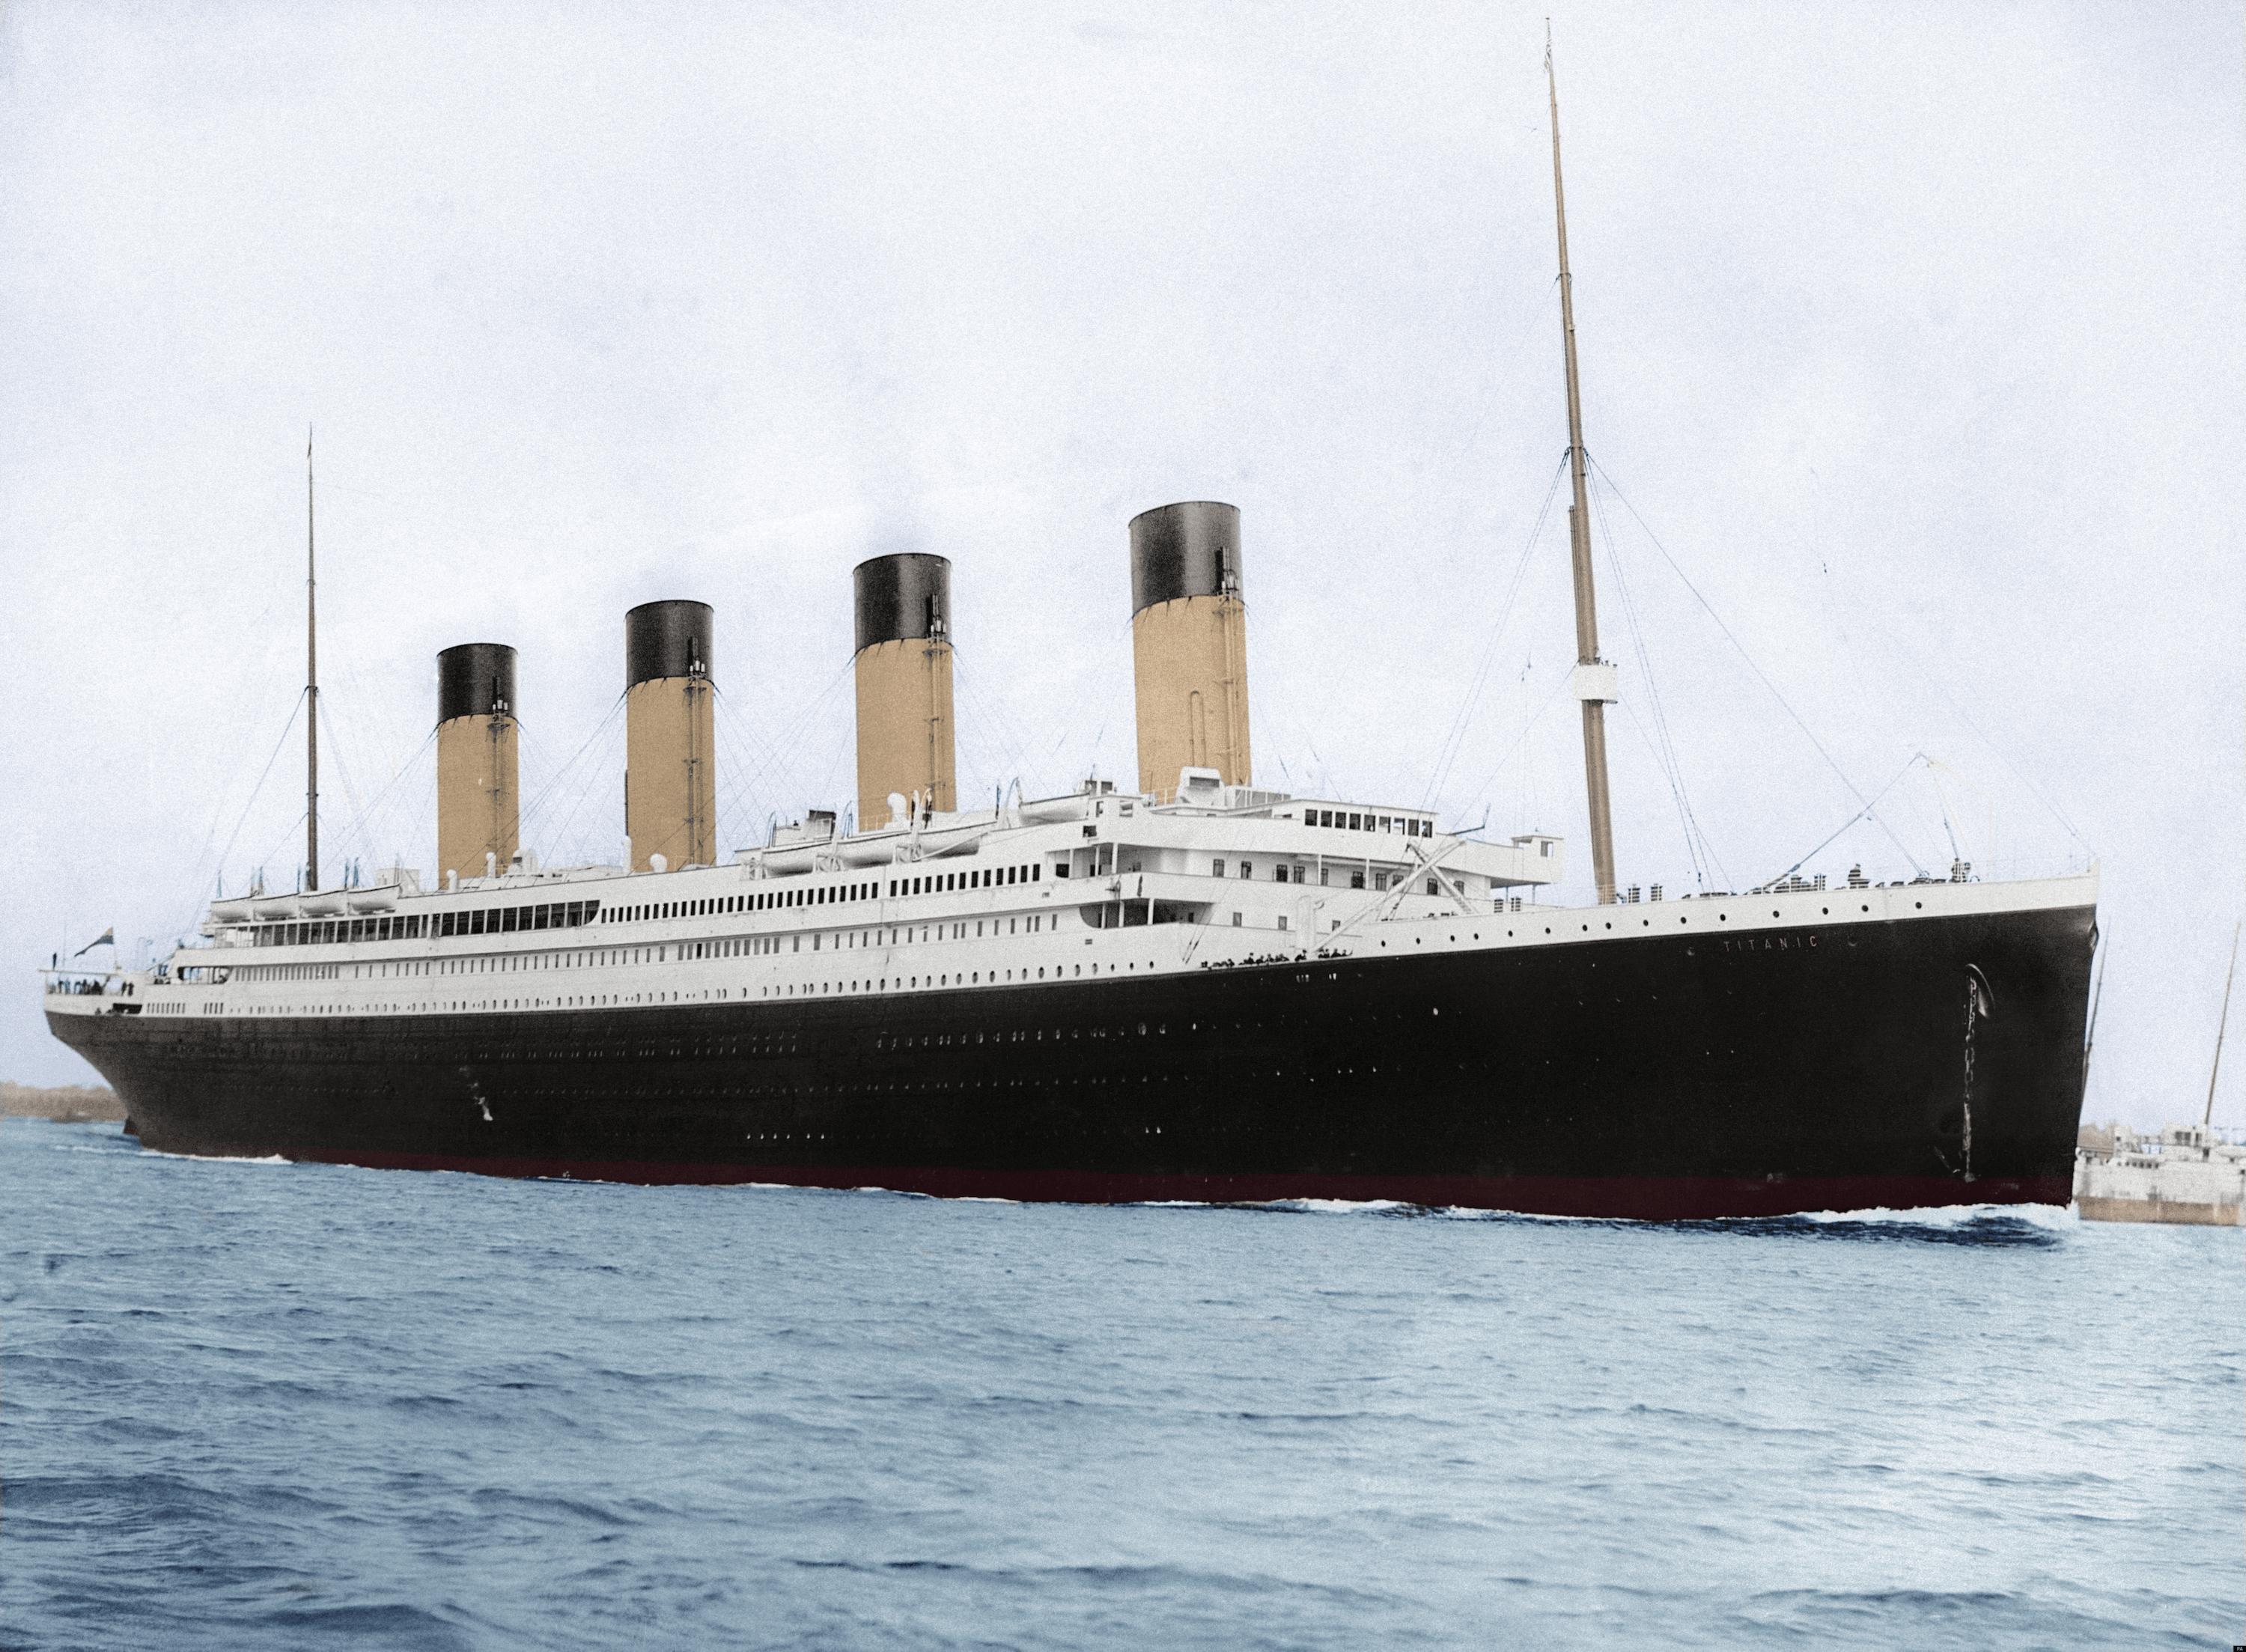
Selecting your first Kaggle competition can feel like standing in front of a buffet: there are so many tempting options, but not all are beginner-friendly. For our journey, we’re starting with the classic Titanic – Machine Learning from Disaster challenge. It’s simple enough to be approachable, yet rich enough to teach you the fundamentals of a complete ML workflow. With a clearly defined binary classification task (predicting survival), clean structured data, and countless public notebooks for reference, it’s the perfect playground to apply the CRISP-DM methodology in practice.
Criteria to Select a Beginner-Friendly Competition
When you’re just starting out, the ideal competition should have a well-defined problem, a small and clean dataset, and plenty of community support. Look for challenges that don’t require external data or complex preprocessing pipelines, structured tabular datasets are best. Public notebooks, discussion forums, and a leaderboard with many first-time participants are also strong indicators. The goal is to learn the end-to-end process, not to build the most accurate model right away, so clarity, simplicity, and learning resources matter far more than prize money or prestige.
Why We Chose: Titanic – Machine Learning from Disaster
The Titanic challenge is practically a rite of passage for data science newcomers and for good reason. It presents a clear objective (predicting passenger survival), uses a manageable tabular dataset, and avoids the need for advanced techniques or heavy computation. More importantly, it has a massive library of public notebooks and tutorials to guide you. By choosing Titanic, we’re not just learning machine learning, we’re joining a shared learning experience embraced by thousands of beginners around the world.
Quick overview of the dataset and problem
The Titanic dataset contains information about passengers aboard the RMS Titanic, including features like name, age, gender, ticket class, fare paid, and whether they survived. The goal is to build a model that predicts survival (1 or 0) based on these attributes. This is a binary classification problem, and the dataset is split into a training set (with known outcomes) and a test set (where you must predict outcomes). Despite its simplicity, the dataset introduces essential machine learning concepts like missing values, categorical encoding, feature engineering, and model evaluation, making it the perfect sandbox to learn and experiment.
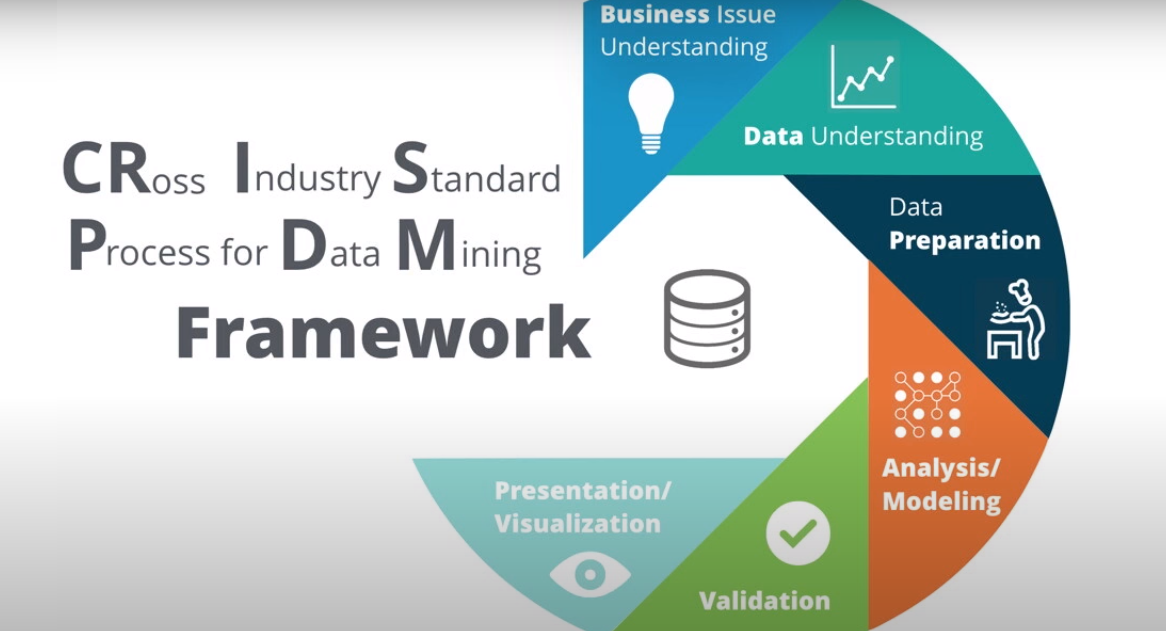
Introducing CRISP-DM
Before diving into code, it’s essential to understand how real-world data science projects are structured, and that’s where CRISP-DM comes in. Short for Cross Industry Standard Process for Data Mining, CRISP-DM is a tried-and-true methodology that guides you through the lifecycle of a data project. It consists of six phases: Business Understanding, Data Understanding, Data Preparation, Modeling, Evaluation, and Deployment. Unlike Kaggle competitions, where the “deployment” phase is usually skipped, following this framework builds habits that are critical for applied AI work in production settings.
We’ll use CRISP-DM as our north star throughout this series. It helps break down the problem into manageable steps, ensures we don’t jump straight into modeling, and encourages a deeper understanding of the data and goals. As you practice this flow with the Titanic challenge, you’ll develop a professional mindset, thinking beyond just accuracy and focusing on process, reproducibility, and clarity. In future competitions (and in real jobs), that mindset will be what sets you apart.
What is CRISP-DM and Why It Matters
CRISP-DM (Cross Industry Standard Process for Data Mining) is a structured approach to solving data problems, widely used in industry for its clarity and flexibility. It outlines six essential phases, from understanding the business problem to preparing the data, building models, and evaluating results. Unlike ad-hoc experimentation, CRISP-DM encourages a disciplined and iterative workflow, helping you avoid common beginner mistakes like jumping into modeling without understanding the context or the data. By following CRISP-DM, you’ll learn to think like a real AI practitioner, not just a competition participant.
The 6 phases of CRISP-DM
-
- Business Understanding – Define the objective from a business perspective and translate it into a data science problem.
-
- Data Understanding – Collect the data, explore it, and identify quality issues, patterns, or anomalies.
-
- Data Preparation – Clean, transform, and organize the data into a format suitable for modeling. This often takes the most time.
-
- Modeling – Apply machine learning algorithms, tune hyperparameters, and train models to address the problem.
-
- Evaluation – Assess whether the model meets the business objectives, not just technical metrics like accuracy or AUC.
-
- Deployment – In a real-world setting, this means putting the model into production. On Kaggle, it usually means generating and submitting predictions.
How we’ll apply CRISP-DM to this challenge
We’ll treat the Titanic challenge as if it were a real-world project, using CRISP-DM to guide each step. Starting with Business Understanding, we’ll explore the core objective: predicting passenger survival. While it may seem simple, we’ll treat it as if a client or stakeholder needed this model for decision-making, pushing us to think about the impact of false positives, fairness across groups, and clarity of results. This mindset helps move beyond “just getting a good score” toward building responsible and explainable models.
Next, we’ll move through Data Understanding and Data Preparation, taking time to analyze missing values, detect outliers, and engineer meaningful features, like combining titles from names or grouping passengers by family size. Once the dataset is in good shape, we’ll jump into Modeling, trying out different classifiers and validating results with cross-validation. We’ll wrap up with Evaluation, asking: does our model actually make sense? And finally, although we won’t deploy in a production system, we’ll simulate that step by creating clean, reproducible code and submitting predictions on Kaggle, reinforcing habits that scale to real-world AI engineering.
Phase 1: Business Understanding
At first glance, the Titanic competition might seem like a simple technical exercise — but behind every machine learning task lies a business question. In this case, imagine you’re working for a historical research organization or a company building educational simulations. They want to understand what factors influenced survival aboard the Titanic, and whether those patterns can be predicted with data. Our mission is to create a model that estimates the probability of survival for each passenger, using features like age, class, gender, and ticket information. But beyond raw prediction, we must consider interpretability: what insights can stakeholders draw from the model? Treating this phase seriously helps you align your technical work with real goals, which is what separates a good data scientist from a great AI engineer.
What’s the goal of the competition?
The primary goal of the Titanic competition is to build a predictive model that determines whether a passenger survived or not, based on a set of features like age, gender, ticket class, and family connections. This is a binary classification task, where the outcome is either 0 (did not survive) or 1 (survived). While the competition score is based on accuracy, the deeper objective is to practice the full data science pipeline, understanding the problem, cleaning data, engineering features, training models, and generating predictions, all while learning how to reason like a real-world practitioner.
What would success look like in a real-world setting?
In a real-world context, success wouldn’t just mean high accuracy on a leaderboard — it would mean delivering insights that are actionable, explainable, and ethically sound. For example, if this model were used in a historical analysis or an educational tool, success would include clearly showing which factors most influenced survival (like gender, age, or ticket class) and doing so in a way that’s accessible to non-technical audiences. Moreover, a successful project would emphasize fairness and avoid misleading conclusions, such as overgeneralizing from biased or incomplete data. Ultimately, success means bridging the gap between technical results and meaningful impact.
Phase 2: Data Understanding
Now that we’ve defined the problem, it’s time to get hands-on with the data. This phase is all about exploration — understanding what’s available, identifying potential issues, and forming initial hypotheses. The Titanic dataset includes two files: train.csv (with known outcomes) and test.csv (where we must predict survival). Key columns include Pclass (ticket class), Sex, Age, Fare, SibSp (siblings/spouses aboard), and Embarked (port of boarding), among others.
During this stage, we’ll look at distributions, correlations, and missing values. For example, we might notice that Age and Cabin contain many nulls, or that survival rates differ significantly between male and female passengers. We’ll also begin to spot possible feature interactions — such as how class and gender together might influence survival odds. This is the detective phase of the project, and the better we understand the data here, the smarter our modeling decisions will be later.
First look at the dataset
The Titanic dataset is a structured CSV file with rows representing individual passengers and columns capturing different attributes. At a glance, we find columns like PassengerId, Survived, Pclass, Name, Sex, Age, SibSp, Parch, Ticket, Fare, Cabin, and Embarked. Some features are numeric (like Age and Fare), while others are categorical (like Sex and Embarked). The Survived column, present only in the training set, is our target variable.
Even at this early stage, we can already spot hints of structure and imbalance, for instance, fewer survivors than non-survivors, or certain columns with many missing values. This initial glance helps us sketch a roadmap for deeper exploration and guides the questions we’ll ask next during EDA.
Exploratory Data Analysis (EDA) Basics
EDA is the process of diving deeper into the dataset to uncover patterns, spot anomalies, and develop intuition. In the Titanic challenge, this means visualizing survival rates across different groups — for example, comparing male vs. female passengers, or survival by ticket class (Pclass). Tools like histograms, box plots, and heatmaps can help us understand distributions, detect outliers, and observe correlations between variables.
We’ll also look for missing values (like in Age and Cabin), assess feature importance, and begin forming hypotheses — such as “women and children were more likely to survive” or “higher class passengers had better chances.” EDA isn’t just about pretty plots, it’s about asking questions, spotting clues, and building the foundation for effective feature engineering and modeling.
Identifying potential issues early (nulls, types, outliers)
Before we can model anything, we need to understand the messiness of the data. The Titanic dataset presents several common issues: missing values, like Age (which is missing for about 20% of passengers) and Cabin (which is missing for most); inconsistent types, such as categorical variables stored as strings (Sex, Embarked) that need to be encoded; and potential outliers, like unusually high fares or passengers with strange family size combinations.
Catching these early helps prevent silent failures later. For instance, leaving missing Age values untreated can bias the model, and not encoding Sex properly can break certain algorithms. By documenting and planning how to handle these problems now, through imputation, encoding, or removal, we set ourselves up for a much smoother modeling phase.
What’s Next
In the next session, we’ll move from understanding the data to preparing it for modeling. This means rolling up our sleeves and writing code, starting with handling missing values, encoding categorical variables, and creating new features that capture useful patterns (like family size or passenger title). We’ll also build simple visualizations to validate our assumptions and ensure our dataset is clean and ready.
By the end of the next step, you’ll have a solid, structured dataset and the confidence to begin experimenting with your first machine learning models. So get your notebook ready, it’s time to go from exploration to execution!
We’ll Move to Data Preparation and Modeling in the Next Post
Now that we’ve explored and understood the dataset, the next logical step is to prepare it for modeling. In the upcoming post, we’ll cover data cleaning, feature engineering, and how to structure the dataset for training a machine learning model. You’ll learn how to handle null values, convert categories into numbers, create meaningful new features, and avoid common pitfalls that can silently degrade model performance.
Once the data is ready, we’ll walk through building your first baseline models using scikit-learn, setting up validation strategies, and interpreting initial results. It’s where the theory starts turning into practical, hands-on ML.
Let’s enhance the future of AI together!